Appearance
File Menu - Calculate
Summary
After completing data entry you can run a hydraulic calculation. The calculation is started by selecting [File|Calculate] or by pressing the Calculate button. This opens the Pre-Calc Questions dialog box where you choose options and verify values before continuing.
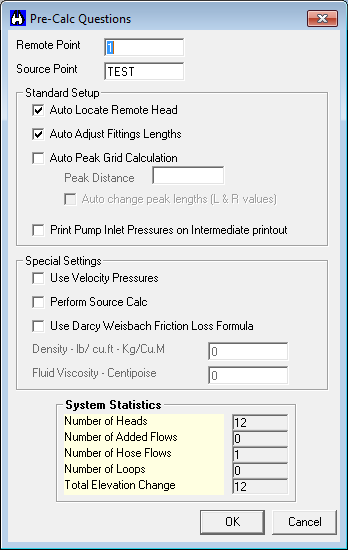
Key options in the Pre-Calc Questions dialog box include:
Remote Point: Automatically filled with the first node having a K-Factor or flow, it can be edited.
Source Point: The node connected to the water supply, listed in the Edit Water Supplies dialog box.
Auto Locate Remote Head: After the first calcuation is run it will find the most demanding sprinkler and update the Remote Point; it is recommended to leave this box checked to produce accurate results.
Auto Adjust Fittings Lengths: Automatically adjusts fitting equivalent lengths for non-Schedule 40 pipe per NFPA 13. Adjustments for C-Factors other than 120 are also performed.
Auto Peak Grid Calculation: For grids only, this theoretically moves the remote area along the grid line and calculates on both sides of the remote area to find the most demanding one. Requires entering Left and Right length markers in the calc input plus a Peak Distance below.
It is recommended to only use this option if your grid is typical. Non-typical lengths and different elevations between sprinklers will produce inaccurate results.
Peak Distance: This is the common distance between sprinklers on your grid line. This value is used to add/subtract the length from your Left and Right markers while the areas are being calculated.
For example, your grid line input shows L35 and R75 as lengths between the mains and its respective edge sprinklers of your remote area. An autopeak distance of 10 will run 3 or more calculations. One calculation as 35/75 (no shift), another as 25/85 (shift left) and a third as 45/65 (shift right). It may continue shifting until it finds the remote area with the highest demand.
Auto Change Peak Lengths: If checked, it will adjust the lengths designated with the L & R markers to match the most demanding area. If unchecked, The L & R lengths aren't adjusted though the Auto Peaking results will appear in the Calculation Summary report.
Use Velocity Pressures: Includes velocity pressures in calculations. The Input Type column of your calculation must have values.
Perform Source Calc: Performs a supply calculation based on available water supply versus the density of the remote area. It will increase the density of the remote area until a safety margin of 0 is achieved, it will then report the maximum density possible with the given water supply. If unchecked, it performs a standard calculation with the most remote sprinkler's minimum flow/pressure requirement.
Use Darcy Weisbach Formula: Calculates using the Darcy-Weisbach formula (requires Fluid Density and Dynamic Viscosity). The Hazen-Williams formula is used if unchecked. Darcy-Weisbach is for specialized systems which do not use pure water, for example anti-freeze loops.
The System Statistics area helps catch data entry errors.
Number of Heads - counts K-Factors and Equivalent K-Factors
Number of Added Flows - count of "+ flows"
Number of Hose Flows - count of "H flows"
Number of Loops - counts loops (eg. a 12 line grid system will be 11 loops)
Total Elevation Change - difference between highest flowing node and water supply
Nodes with undesignated elevations - count of nodes which only appear in the Node2 column and therefore has no set elevation
Error checking utilities are included when some errors are encountered. Pressing the Error Check button helps find mistakes. Detected errors appear in the Error Display dialog box. You can highlight an error and press Explain This to Me for a description or Show Me Where to go to the error in the data (the line turns yellow).
After completion of the calculation, a dialog box shows system demand and system pressure. A green dot and the safety margin appear if demand is under supply. A red dot and its deficit appear if demand exceeds supply.
Pressing Details expands the dialog showing how the calc was processed. The View button is disabled as Windows11 removed Wordpad. Click the View Calculation button in the main HydraCALC window to view the raw calc data.
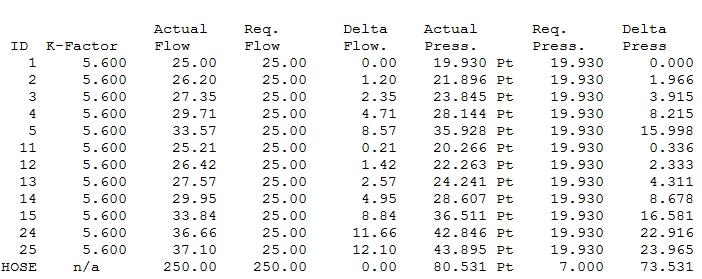
The Calculation Summary report includes detailed information about the calc. The first section compares flowing sprinklers and lists hose flows (there is a different format for grid systems).
- Actual Flow: Flow calculated from each sprinkler.
- Required Flow: Minimum flow needed based on density, area, and pressure.
- Delta Flow: Overage due to friction losses (difference between Actual and Required).
- Delta Press: Similarly applies to pressure; the most remote sprinkler will have a Delta Press of 0.000.
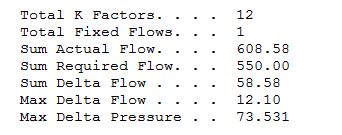
The middle section summarizes values from the first section, including Sum Delta Flow (total flow overage). A large Sum Delta Flow with a steep water supply curve might suggest adjusting pipe sizes.
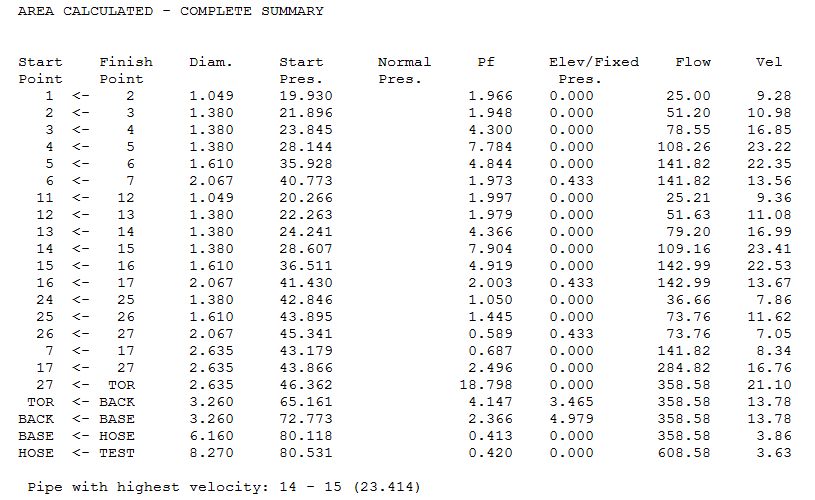
The next part summarizes all flowing pipes, listed in System Piping tab order. An arrow indicates flow direction between Start and Finish Points. Flow direction in trees is typically consistent if input logically; loops/grids typically show arrows in both directions.
- Normal Pres.: Filled if Velocity Pressure option was checked.
- Pf: Pressure friction loss in the pipe segment (psi, Bar, KPa).
- Elev/Fixed Pres.: Losses from elevation changes, backflow preventers, etc. (psi, Bar, KPa).
- Flow: Flow through that section of pipe (gpm or lpm).
- Velocity: Water velocity in that pipe (ft/s or m/s). The pipe with the highest velocity is noted after the summary.
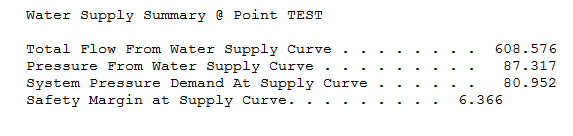
The last part shows total system demand and available water.
For grids with autopeak turned on, an additional section appears before the first section. This report indicates the remote area location. The List of Pipes for Area Calculated section shows where the remote area ended up after shifting. This helps you mark the area on the plan. Distances between reference points are listed. The terms "Left" and "Right" relate to input markers (L/R) and may not be true physical directions (eg. your gridlines may run north/south).
The next grid section shows demands for the remote area. AREA CALCULATED is the most remote area referenced in the List of Pipes section. Flow Required and Safety Margin are reported for this area. Demands are also reported if the area is shifted one head LEFT or RIGHT. If multiple LEFT or RIGHT entries appear, it means your remote area was shifted multiple times in one direction in order to find the most remote area.
The Typical Distance Between Heads and the Split Point Used in Area Calculated (the most remote head's reference point name) are also reported.
How Do I Use The Button
To run a calculation:
- Complete your data entry in the relevant tabs (System Piping, Equivalent K Piping, etc.).
- Select [File|Calculate] or press the Calculate button.
- In the Pre-Calc Questions dialog box, review and select the desired options.
- If presented, press the Error Check button to check for data errors before calculating.
- Press OK in the Pre-Calc Questions dialog box to start the calculation.
- After the calculation finishes, review the results in the summary dialog box.
- Press the Details button for more technical info.
- Note: In HydraCALC Sizer, the buttons are Graphical Pressure Usage Display button and View Calc Summary button, leading to similar reports.)
HydraCARDs (Troubleshooting)
tbd